Realistic Farming DLC

Suggestions for new DLC projects.

Do you like the features

I am all in for it
32
71%
That is great, and see my comments below
1
2%
It adds too much complexity
6
13%
I do not like all the points
1
2%
If I want to enjoy farming I play Farmville instead
0
No votes
It should stay a game, not a capitalism simulator
1
2%
I don't like it at all
4
9%
 
Total votes: 45

User avatar
David
Community and Marketing Manager at Enlight
Posts: 9379
Joined: Sat Jul 03, 2010 1:42 pm
Has thanked: 21 times
Been thanked: 53 times

Re: Realistic Farming DLC

Post by David »

weather factor is calculated weekly/monthly accumulatively - 1 would mean the whole growing period the weather conditions were ideal. Impacts can be too cloudy, not enough rain, too much rain, extreme weather events, where the latter one can easily destroy 90% of a harvest.
How does a location's weather factor match with a crop's preferred growing conditions?

In other words, the weather factor you stated here comprises of several factors. How should we break it down into programmable variables?

Could you list the attributes that you think each type of crop should have? And along the same line, what attributes each location should have?
User avatar
Brain
Level 3 user
Posts: 97
Joined: Sat Jun 16, 2018 1:20 pm

Re: Realistic Farming DLC

Post by Brain »

Hi, David,

The weather factor can be a random variation value from 1.0 to 0.0 with huge skew towards 1.
We can explain it plainly as diversion from optimum growing conditions, caused by weather fluctuations and environmental events. If we do not actually simulate weather per city but just have a randomized lookup table that might be solid enough.
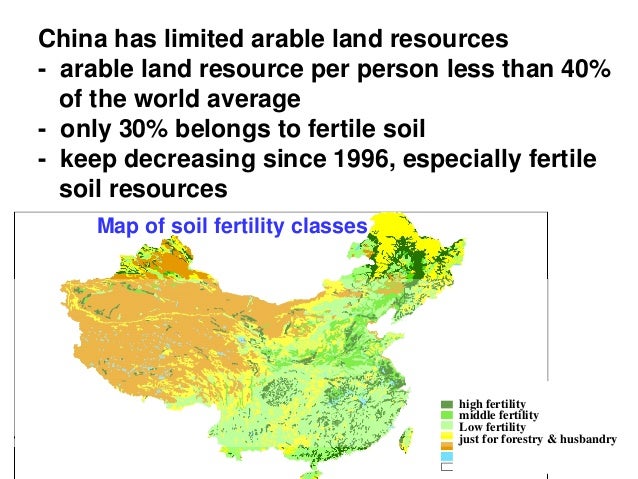
What we define per city/region is the soil acidity (which could be an overlay map with small fluctuations on a region, but more or less around a fixed value for that region), the temperature, precipitation and sun input (W/m^2). For each of these excluding soil acidity there will be a skewed distribution function calculated per region.
For each crop there will be a similar curve describing what the plant demands as ideal condition as well as their tolerance limits. For each property the overlap integral of these curves divided by the area of non overlap would form a factor between 1.0 and 0.0
Image
These factors all multiplied will be the final suitability factor for the given crop in the given region. 1.0 is Eden-like conditions, 0.0 means this crop will never grow here. No harvest can be expected. You do not grow Avocados on Antarctica. But this factor is a static for the region, generated once per game initialization (or again if the player opens up a new City/Region)

Now lets pretend you found an Eden for Tomatoes. Even in Eden conditions there might be a spell of bad weather which will negatively affect your harvest, some extra cloudiness, storm, you name it. This is what I call the weather factor. It is kind of an abstraction that simulates fluctuations that cumulatively negatively influence the actual harvest output. I don't think the player wants to study the weather report and a prediction all along the growing season (but he would like to see the skewed curves graphically so he can compare them with crop types to see the overlap and expected harvest success), but he might want to see a current valuation of how much percent of an ideal harvest he can expect, that is updated weekly per farm. Most of the days this factor is somewhere between 1 and 0.998, (for each growing day multiplied with the result of the previous days, initialized with 1) , but lets have a couple of stormy days and they hit with 0.9 or 0.8 into the total calculations. Have a volcanic event, and the weather factor will be 0.3 for a week. The cumulative weather factor will drop quickly toward 0%. So even in Eden you might have a failing harvest if you had a lot of bad luck. Numbers her might require some fine tuning and testing to find not every player facing all the time century-flood like harvest losses.
Alternatively to one set of static skewed curves we might have a set per city for each month of a year and so would be able to simulate seasons. That would allow to define the optimum planting/harvesting period for each crop for each city, even allowing simulation based on their geographic location, summer and winter, with opposite on the southern hemisphere, and little of it around the equator. But that would be a bit beyond the minimum feasible product.
User avatar
David
Community and Marketing Manager at Enlight
Posts: 9379
Joined: Sat Jul 03, 2010 1:42 pm
Has thanked: 21 times
Been thanked: 53 times

Re: Realistic Farming DLC

Post by David »

In terms of user interface, what fields should be displayed for a crop and a location using your model?

For your reference, I am posting the UI screenshots of the original Capitalism Plus which simulates the weather effects on crops with more details.
Attachments
soil.jpg
soil.jpg (98.88 KiB) Viewed 2096 times
Rainfall.jpg
Rainfall.jpg (106.69 KiB) Viewed 2096 times
farm.jpg
farm.jpg (102.02 KiB) Viewed 2096 times
Climate.jpg
Climate.jpg (96.31 KiB) Viewed 2096 times
User avatar
Brain
Level 3 user
Posts: 97
Joined: Sat Jun 16, 2018 1:20 pm

Re: Realistic Farming DLC

Post by Brain »

Ah, good old times, I played that version, too. :D

These screens as simple as their presentation is, have a few starting points.
There are theoretically two approaches to select a farm location, one is coming from "Where on this planet does it make most sense to grow Tomatoes?", the other one is coming from "I want to sell Fruits in Los Angeles, so what can I grow there?"

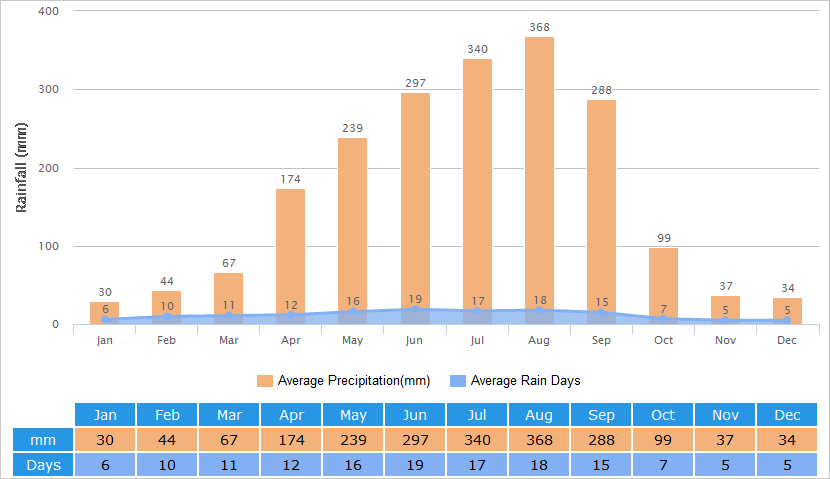
The first approach would be starting from an overview, like the farming guide. Lets call it the Planting Guide. For each crop that you can select in the list you get a detail pane showing the crop needs as curves. You get a rating per city/region describing how well suited it is for the selected crop, with a detail pane for the selected city showing their average environmental properties as curves. This helps to pick a city/region for further selection steps.
Not changing your current UI to seriously, in the minimap (aka micromap) there will get a crop overlay that you can activate and select a crop. The micromap style changes to a presentation from a dark red to a bright green showing where the properties for the selected crop match best. Similar as for micromap filters you can switch crops with space key and might find a spot suitable for more than one kind of crop.
On this view only the soil acidity and current soil fertility actually make an impact, because humidity, sunlight and temperature fluctuate over the year, and their impact is more seasonal then map based - they define the growing seasons mainly. The growing season is a property seen again in the Crop rowing unit after crop selection. Longer season can allow richer harvest, maybe even multiple harvests per year

One thing your screenshots show, this all sucks if the climate model and artificial map process are not looking natural. In 1995 this was kind of tolerable, although not pretty. but nowadays it would be great if a bit of science would be applied to have the maps generated, or play on a proper earth map based on true numbers.

Image
Image
Image
Image
Image
User avatar
David
Community and Marketing Manager at Enlight
Posts: 9379
Joined: Sat Jul 03, 2010 1:42 pm
Has thanked: 21 times
Been thanked: 53 times

Re: Realistic Farming DLC

Post by David »

humidity, sunlight and temperature fluctuate over the year, and their impact is more seasonal then map based
What are the effects of the amount of rainfall,
humidity, sunlight and temperature in the game?
User avatar
Brain
Level 3 user
Posts: 97
Joined: Sat Jun 16, 2018 1:20 pm

Re: Realistic Farming DLC

Post by Brain »

Sunlight, Humidity, Rainfall and Temperature are weekly evalued by the simulation, based on bell curves for what is common there, gaussian random number, as city/region wide numbers. For each crop in sowing season, that is currently growing in a Crop Growing Unit these properties are compared to how close to ideal conditions that is, by looking up the deviation on the crop expectation curve for that property. zero deviation = ideal condition, multiplicator = 1, else it is a lookup value. I think that can be better explained visually. I am doing that only for the temperature, but all four multiplicators would have to be calculated and applied to the harvest result. lets pick Grapes as the example crop. Grapes like temperatures between 13-21 degrees Celsius during their growing season of 180 days.
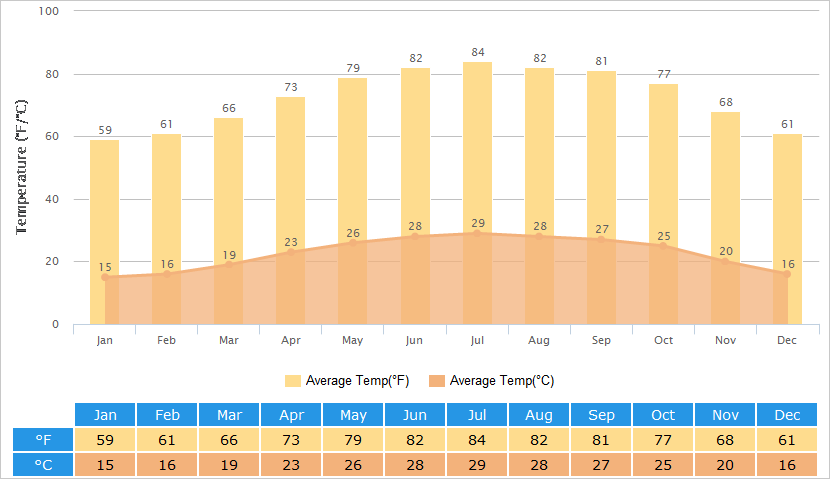
Temperatures in New York:
Image
The temperature in NY in July fluctuates between 29.6°C and 20.2°C with a median of 24.9°C. July would almost be too hot to grow grapes efficiently, about 15% of the time the temperatures are in the tolerable range. April, May and June, as well as September and October have better conditions for growth, for example in October temperature lies between 10 and 20 degrees Celsius wich overlaps the acceptable temperature range about 80% of the time.
Lets divide the 180 days of growth period into 26 weeks (we could do 6 months, too but that would not be as nice for UI feedback). each of the growing weeks contributes 1/26 to the harvest efficiency. for each of the weeks all growth related property factors, the static ones, the seasonal ones, and the farm specific ones are multiplied with each other, divided by 26, then added to the counter of the Crop growing unit. this is a value that under most ideal conditions can be 1.0 but likely will be lower. so if a Crop Growing Unit would have under ideal conditions an output of 10 tons of grapes (number arbitrarily picked), the resulting factor could cause the realized harvest would be more likely 7tons.
In a similar way we multiply and sum up quality related factors on a weekly basis. Quality is based on farmer experience, equipment quality, quality of antifungals and pesticides, soil acidity. I think sunlight and rainfall should be contributing to both quality and quantity. Important is that this is not a linear correlation, while rain is necessary, too much rain is detrimental, same is valid for all of the properties.
User avatar
David
Community and Marketing Manager at Enlight
Posts: 9379
Joined: Sat Jul 03, 2010 1:42 pm
Has thanked: 21 times
Been thanked: 53 times

Re: Realistic Farming DLC

Post by David »

Will there be any adverse conditions that do not only affect yield and quality, but so serious that they are enough to destroy a plant?

For instance, will grapes die in July in New York because the temperature is too hot?

What about trying to grow grapes in a location that is hot all year round like Singapore?
User avatar
Brain
Level 3 user
Posts: 97
Joined: Sat Jun 16, 2018 1:20 pm

Re: Realistic Farming DLC

Post by Brain »

If growing outside of tolerable zones there will be almost no yield. The player should make an informed decision beforehand, i.e. the maximum possible yield rate should be displayed in the Select Crop dialog for each crop, as well as in the Farming Guide details for the selected City/Region.

I think there needs to be logic that simulates crop destruction if the environment conditions are too bad. So beside of the usual factor that adds to the yield and quality on a weekly basis, there would be a destructive factor that will be applied to the yield and quality counter values calculated so far. In the case of a bad drought, heat wave, or weather events like a Tornado, the progress made so far might be totally eradicated. if a tornado hits at 95% completion of the Crop growing period with a value of 0.1, it means about 90% of the harvest is lost. A huge rain event could be just causing quality loss for the grapes, not yield loss. A drought would be a yield loss, but not so much a quality loss. I think some balancing efforts with reading some background literature is helpful here.
User avatar
David
Community and Marketing Manager at Enlight
Posts: 9379
Joined: Sat Jul 03, 2010 1:42 pm
Has thanked: 21 times
Been thanked: 53 times

Re: Realistic Farming DLC

Post by David »

So each of these: Sunlight, Humidity, Rainfall and Temperature, there is an ideal value for a crop? Or have a pair of variables defining the ideal range?

Is it possible to find all the necessary data for all crops from the Internet?

How is sunlight measured?
User avatar
Brain
Level 3 user
Posts: 97
Joined: Sat Jun 16, 2018 1:20 pm

Re: Realistic Farming DLC

Post by Brain »

David wrote: Thu Jul 12, 2018 11:14 am So each of these: Sunlight, Humidity, Rainfall and Temperature, there is an ideal value for a crop? Or have a pair of variables defining the ideal range?
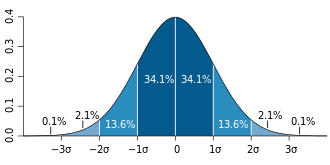
Yes, as well as soil acidity. I was thinking about it, I think ranges are a way to go, an ideal range, an tolerated range. I wonder if we could use the parameters that define bell curve:
Image
where
\mu is the mean or expectation of the distribution (and also its median and mode),
\sigma is the standard deviation, and
\sigma ^{2} is the variance.
Image
David wrote: Thu Jul 12, 2018 11:14 am Is it possible to find all the necessary data for all crops from the Internet?
I am quite sure that we can find this. In my efforts for the Food and Beverages mod I found most of it quickly.
David wrote: Thu Jul 12, 2018 11:14 am How is sunlight measured?
either in W/sqm/day or more simply in sunny days per week. the first one is probably more technical, like in solar power generation.Sunny days would be better to understand. A little bit more detailed would be sunny hours per day which could be interesting for seasonal calculations. winter days are shorter.
Post Reply